 |
Web DSSR for dissecting the spatial structures of nucleic acids |
 |
| Home | Saturday, February 14, 2026 04:47 |
Tutorial
| Analysis | Reconstruction | Visualization |
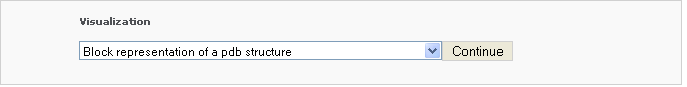
The visualization component creates vector-based drawings and scenes that can be rendered as raster-graphics images, allowing for easy generation of publication-quality figures. The server takes a user-uploaded PDB file or a PDB/NDB ID, and returns various representations of the structure or parts of it. Three functions are provided: 1) Calladine-Drew base and base-pair ‘block’ representation of a pdb structure, 2) Visualization of stacking between bases in a base-pair step, and 3) Block representation of an ensemble of PDB coordinates.
Block representation of a pdb structure
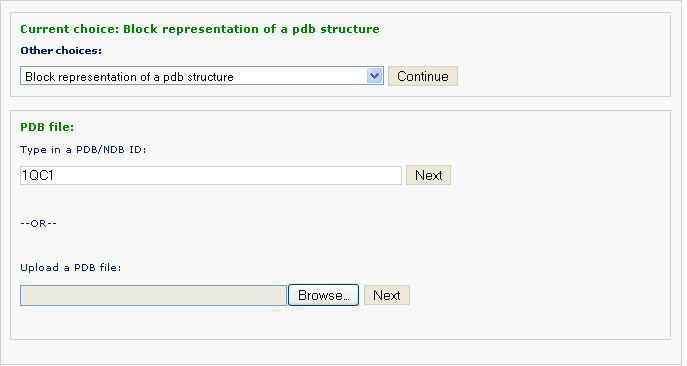
This tool generates a schematic image which combines base block representation with protein ribbon. The image has informative color coding for the nucleic acid part and is set in the "best-view" by default. By choosing this option under the dropdown box of 'Visualization', the user will be asked to input a pdb file via two options: 1) using PDB/NDB ID and 2) uploading a customized pdb file. After clicking 'Continue' button, the pdb file will be analyzed by the server and the page is redirected to an intermediate page, where various questions will be asked depending on the nature of the pdb structure.
Example 3 -1: Type in a PDB ID: 1QC1
After typing the pdb ID 1QC1 and clicking the 'Next' button, the user is asked if a rotation of the structure is wanted. The default block view places the structure in a 'best-view' angle, i.e. the image is shown on the plane of the two most major principal conponents. For studying or publishing purpose, users can specific rotation along either of X-, Y-, and Z-axis with an arbitrary angle.
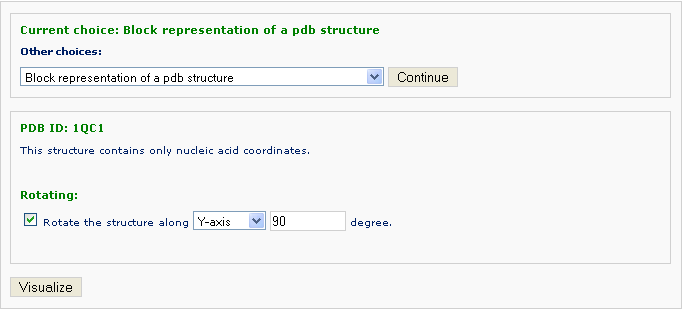
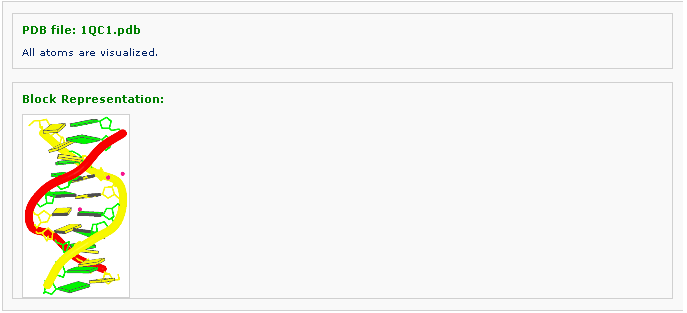
After clicking 'Visualize' button, one is directed to the result page, where the generated image is displayed.
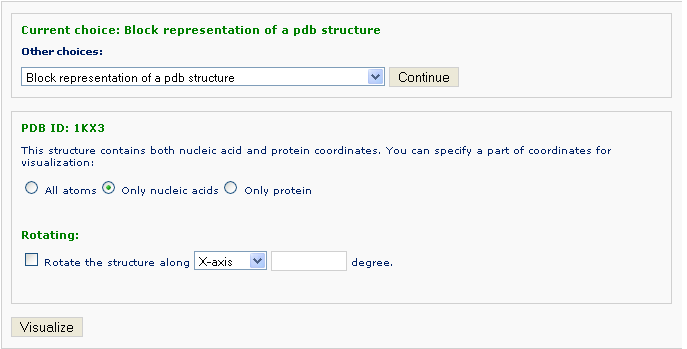
Example 3 -2: Type in a PDB ID: 1KX3
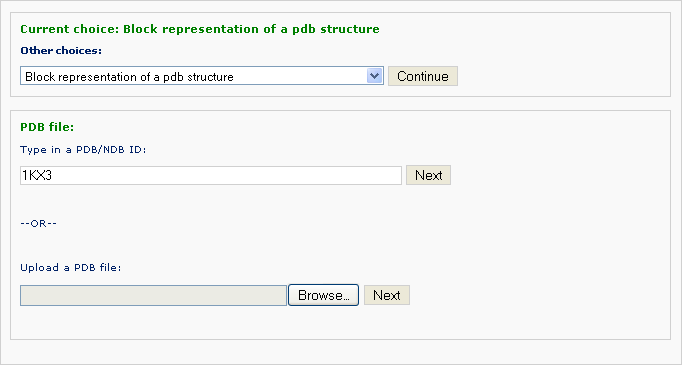
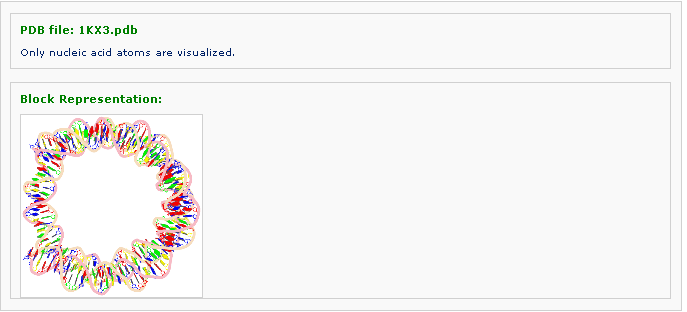
Different from Example 3-2, this PDB structure contains both nucleic acid and protein coordinates. The user is asked whether only a part of the structure is visualized, for instance only nucleic acid or only protein atoms. The default is to visualize the whole structure.
After clicking 'Next' button, the page is redirected to the display of generated block representaion of the structure.
Stacking diagram of base-pair steps
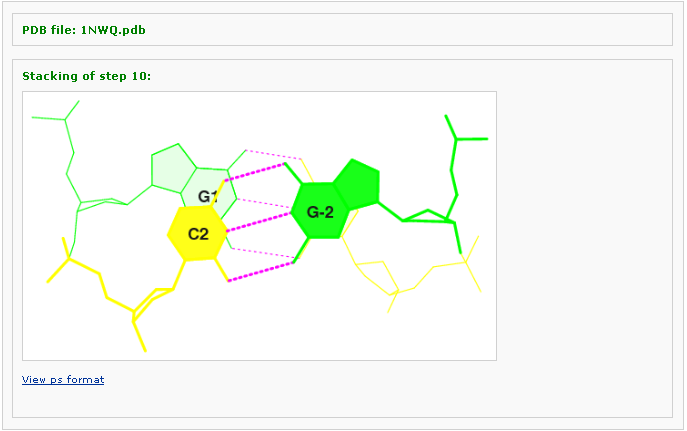
Example 3 -3: Type in a PDB ID: 1NWQ
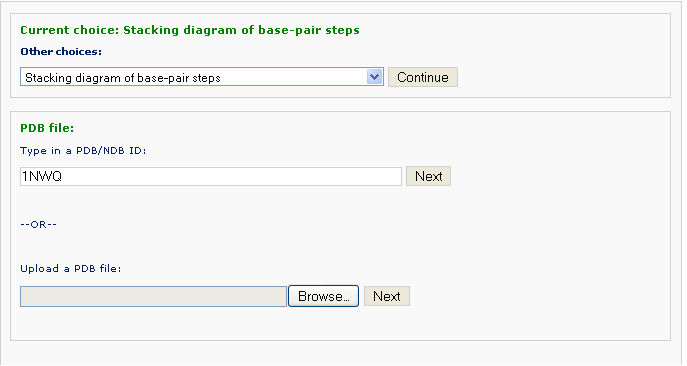
This tool generates a stacking diagram image a PDB file, with H-bonds, filled based ring, and labeling. By choosing this option under the dropdown box of 'Visualization', the user will be asked to input a pdb file via two options: 1) using PDB/NDB ID and 2) uploading a customized pdb file. After clicking 'Continue' button, the pdb file will be analyzed by the server and the page is redirected to an intermediate page, where various questions will be asked depending on the nature of the pdb structure.
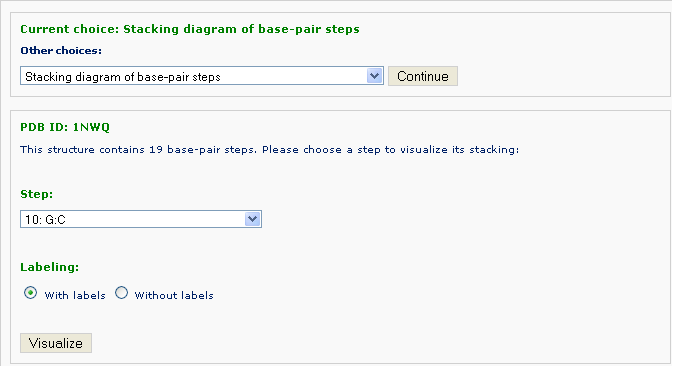
The number of base-pair steps are found by conduction the same analysis as in Analysis component. One can pick one of the steps and forward to view stacking between the two steps selected:
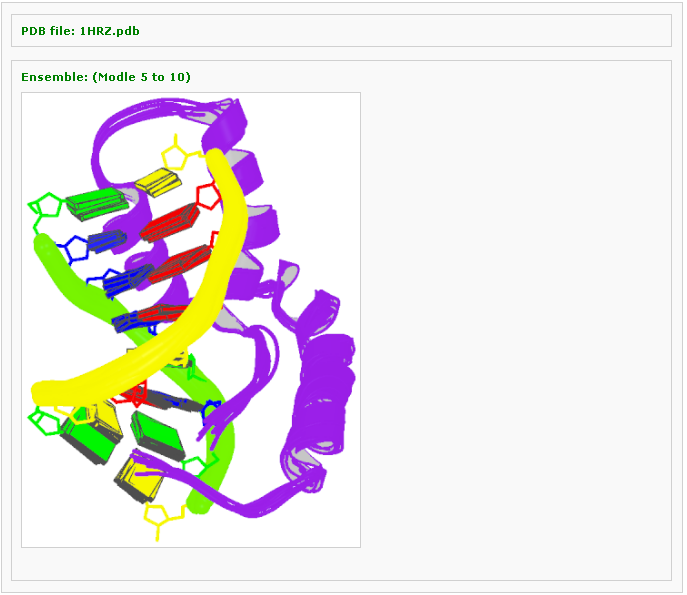
Block representation of an ensemble of structures
Example 3 -3: Type in a PDB ID: 2NP2
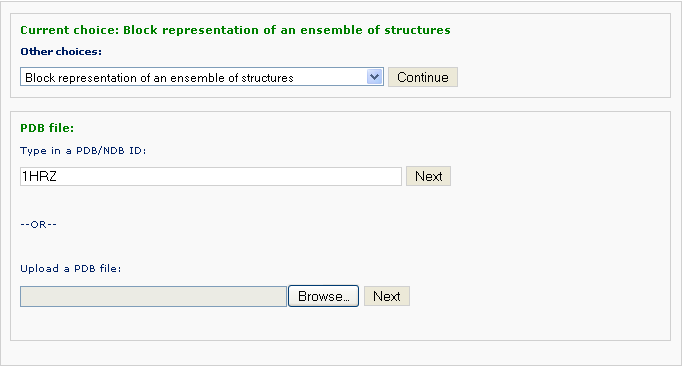
This component generates a schematic image which combines base block representation with protein ribbon for an NMR ensemble. This function is only applied to multi-model structures, otherwise error messages will be thrown.
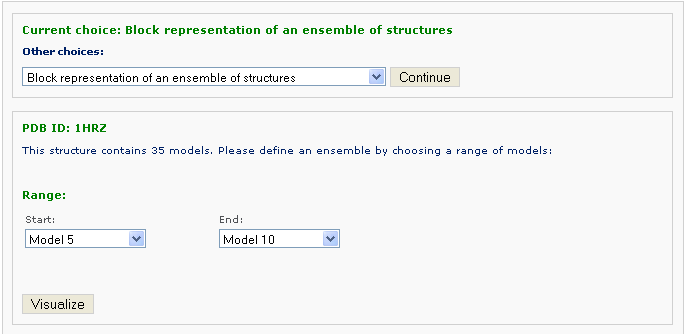
Then you can define an ensemble of models with choosing the starting model and ending one. Then click the 'Visualize' button to view the ensemble image: