 |
Web DSSR for dissecting the spatial structures of nucleic acids |
 |
| Home | Saturday, February 14, 2026 03:35 |
Tutorial
DSSR User Manual
In progress...
| Analysis | Reconstruction | Visualization |
The analysis component determines a wide range of conformational parameters — such as the identities and rigid-body parameters of interacting nucleic-acid bases and base-pair steps, the nucleotides comprising helical fragments, etc. — from a user-uploaded PDB-formatted file or a PDB/NDB ID (the structure identifiers used respectively in the Protein Data Bank and the Nucleic Acid Database). The output files can be viewed on the web or downloaded. Selected sequence and base-pairing information is reported in Grid-view tables with sorting and searching capabilities.
Analysis by PDB/NDB ID
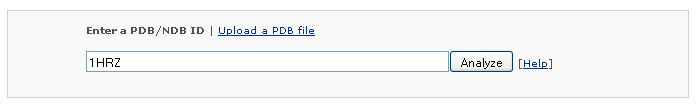
For a nucleic-acid-containing structure deposited in the Protein Data Bank (PDB) or Nucleic Acid Database (NDB), one can directly type in the valid ID. Before, conducting an analysis on the website, users are encouraged to verify the PDB/NDB ID at the PDB or NDB website and gain some familiarity with the structure.
Example 1 -1: Type in a PDB ID 2NP2
After clicking the 'Analyze' button, the use is redirected to the results page, which contains four sections:
1) Brief Description:
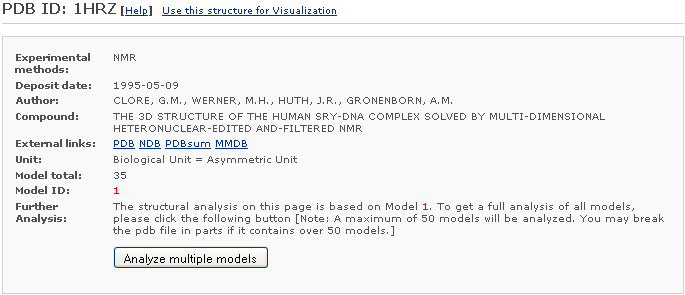
This section briefly describes the type of structure, author, compound, experimental measurement, and resolution (if the experimental measurement is X-ray), and lists both the PDB ID and the NDB ID (if any). Some external links are provided. If the structure is an NMR structure, the number of models in the file will be counted and reported and which model (model ID) is currently analyzed. For files with multiple structures, the user is given the option to analyze multiple models [Note: a maximum of 50 models will be analyzed. To analyze emsembles with more than 50 models, the file should be broken into parts.].
2) Block Representation:
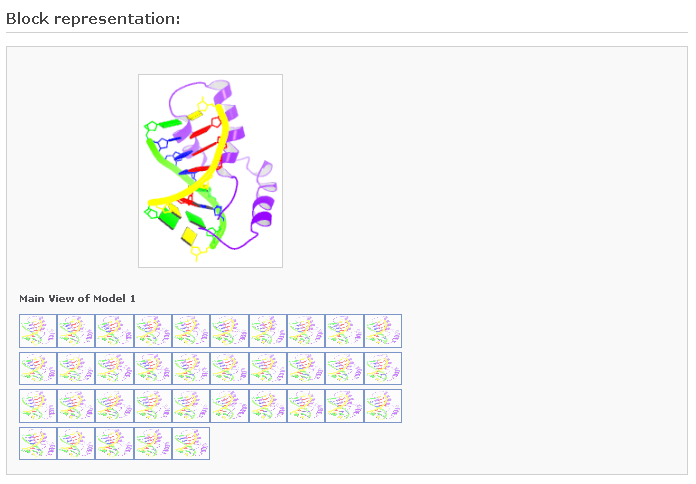
This figure is drawn following the Calladine-Drew schematic block representation of the bases in a DNA structure (Calladine & Drew, 1997). The same representation is used in the PDB and NDB websites, and is also used here to describe RNA structures. Move your mouse to the small image icons at the botton to display other views. [If this is a multi-model NMR structure, each icon represents a sample of the structure among the ensemble. Click one of them to choose a model to analze (identified by Model_ID in the 'Brief Description' part).]
3) Output file of derived nucleic-acid structural parameters:
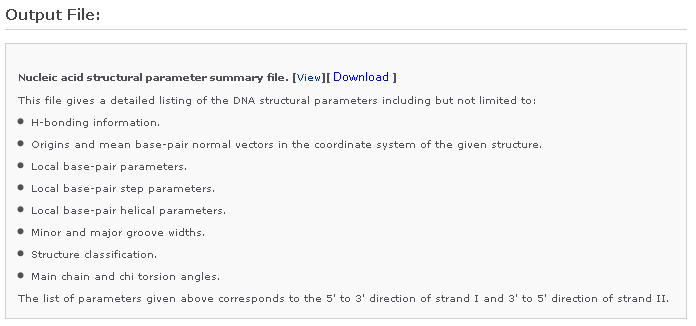
The output file contains a comprehensive compilation of nucleic-acid structural parameters. A brief description of each type of parameter can be found in the 3DNA user's manual, pages 14-16.
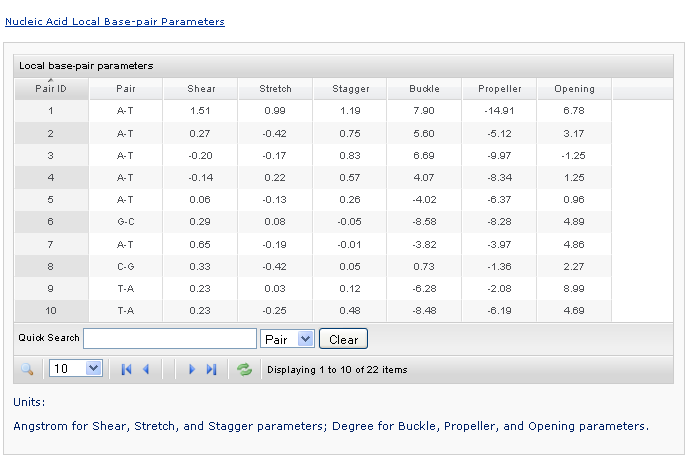
4) Parameter tables:
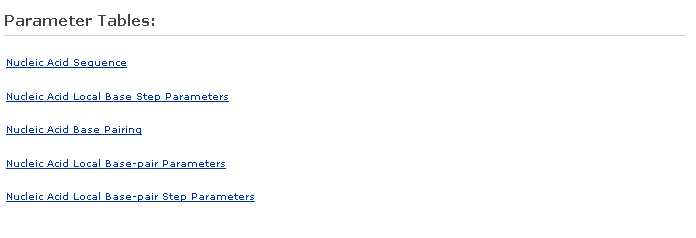
This section contains selected information from the output file. Users can click each link to show/hide the content. The base, base-pair, and base-pair step parameters are presented in Grid-View tables. The angles are expressed in degrees and the distances in Angstrom units. Data can be sorted by pressing the header of each column. A simple quick search is also provided.
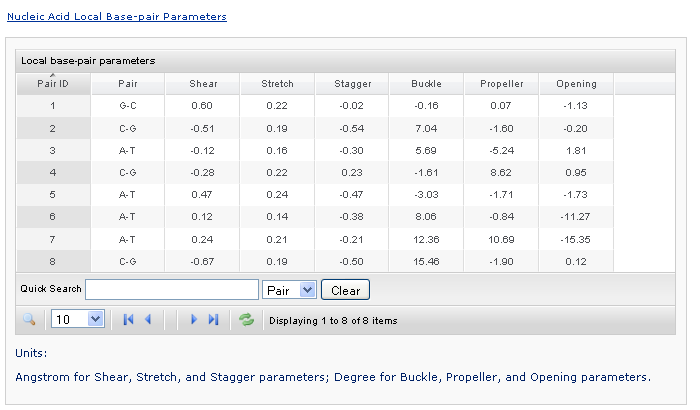
Taking the local base-pair-parameters table as an example, the data are originally sorted by Pair ID. Clicking the column header to sort the data by the name of the bbbase-pairs. Clicking a column labeled by a parameter will sort the data by the specified numerical value. Users can also control the number of rows displayed on each page.
-- Multiple-model analysis --:
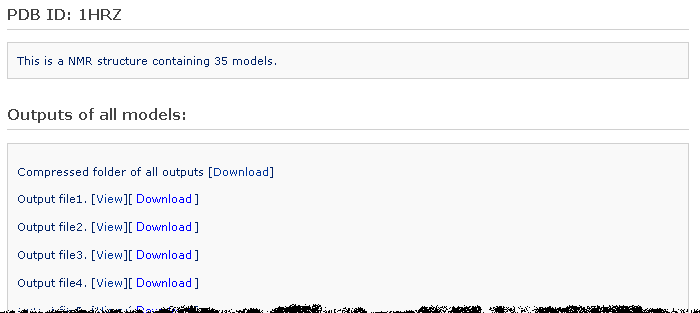
Get back to the Brief Description section. If this is a NMR structure, after clicking the 'Analyze multiple models' button, the user is then directed to another results page, which reports a list of structural parameter output files, one for each model. A compressed folder including all the output files in '.tar.gz' format is offered for downloading.
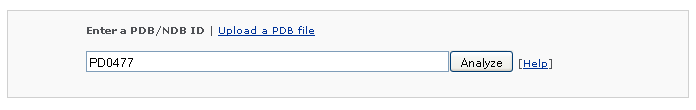
Example 1 -2: Type in an NDB ID PD0477
After clicking the 'Analyze' button, the use is redirected to the results page, which contains four sections:
1) Brief Description:
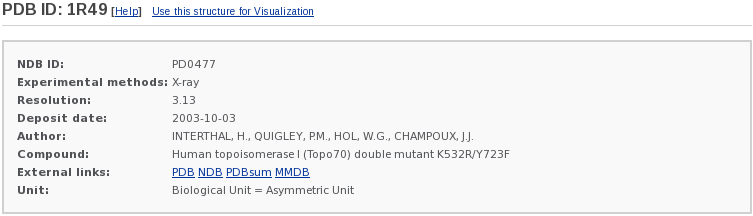
This section briefly describes the type of structure, author, compound, experimental measurement, and resolution (Note: NDB IDs are only for X-ray structures), and lists both the PDB ID and the NDB ID. Some external links are provided.
2) Block Representation:
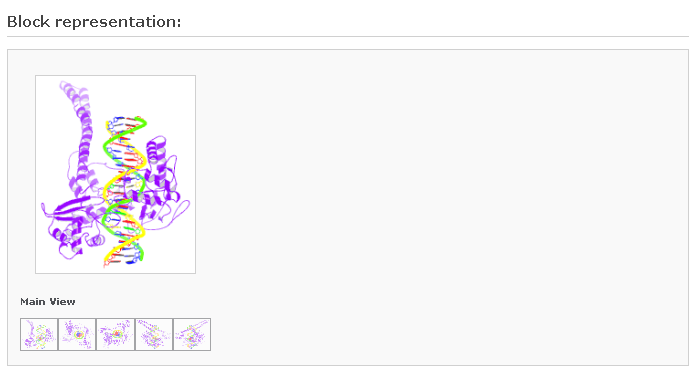
This figure is drawn following the Calladine-Drew schematic block representation of the bases in a DNA structure (Calladine & Drew, 1997). The same representation is used in the PDB and NDB websites, and is also used here to describe RNA structures. Move your mouse to the small image icons at the botton to display other views.
3) Output file of derived nucleic-acid structural parameters:
The output file contains a comprehensive compilation of nucleic-acid structural parameters. A brief description of each type of parameter can be found in the 3DNA user's manual, pages 14-16.
4) Parameter tables:
This section contains selected information from the output file. Users can click each link to show/hide the content. The base, base-pair, and base-pair step parameters are presented in Grid-View tables. The angles are expressed in degrees and the distances in Angstrom units. Data can be sorted by pressing the header of each column. A simple quick search is also provided.
Taking the local base-pair-parameters table as an example, the data are originally sorted by Pair ID. Clicking the column header will sort the data by the name of the base-pairs. Clicking a column labeled by a parameter will sort the data by the specified numerical value. Users can also control the number of rows displayed on each page.
Analysis by uploading a PDB-formatted file
One can upload a customized structral file in PDB format. The user can link to the Protein Data Bank website for the information about PDB file format. The user can also verify a customized PDB file using the Protein Data Bank Validation Service.Example 1 -3: Upload a PDB file [Example pdb file]
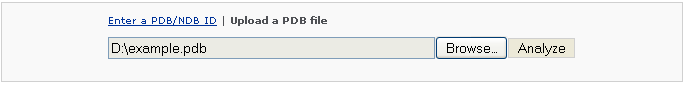
The output obtained upon clicking 'Analyze' will resemble that provided after entering a PDB/NDB ID. Since analysis of multiple models is provided, users can upload a multi-model PDB file, such as an ensemble of states generated along a short molecular-dynamic trajectory, and download the ouput files describing the structural parameters of each model. One can also visualize an ensemble of models with the Visualization component.
Note: On the top of the results page, the user can directly analyze a structure with a different PDB/NDB ID or upload a new file, rather than go back to the previous page.
Reference:
(Calladine & Drew 1997) Calladine, C.R. and Drew, H.R. (1997) Understanding DNA: The Molecule and How It Works. 2nd Edition ed. San Diego, CA, Academic Press.